
Back to fundamental measurement research
After the trip to China we had to make new plans what we would like to do. Irmtraud had finished the editing of two books on decision research. Willem had to decide what to do after he stopped at the NIMMO-telepanel.
The work of the NIMMO–telepanel was not just a failure, 70 MTMM experiments were done using the panel and Annette Scherpenzeel had in 1995 finished her PhD research with a meta-analysis of these data.
Also the IRMCS groups provided a lot of new data, although it was less than we had hoped for. In all participating countries one MTMM experiment was done using the same life satisfaction questions. That offered of course also a possibility for further research.
Only in Austria 10 MTMM experiments were done by Richard Költringer. He also had done a meta- analysis. He wrote about his research a book in German.
The two meta-analyses were done in line with the meta-analysis of Frank Andrews on MTMM experiments in the USA.


Frank Andrews Annette Scherpenzeel Richard Költringer
This means that there were three meta-analyses done in three different languages: English, German and Dutch. All three used their own set of variables to predict the quality of survey questions, evaluated by reliability and validity coefficients of the questions. Even the definition of these coefficients was a bit different between the American and the European studies. What all three studies clearly showed was that the quality of survey questions can vary considerably. This means that it is important to know what determines the quality of questions. The problem was that the results across the countries and the languages could not be compared.

Different research problems
Given that we had a lot of data I thought that we should once more look at all the steps of the process in order to determine how we should continue our research to evaluate the quality of survey questions in a cross national context. I considered the following fundamental steps in the process with the more methodological oriented researchers in the IRMCS group:
Given that we had a lot of data I thought that we should once more look at all the steps of the process in order to determine how we should continue our research to evaluate the quality of survey questions in a cross national context. I considered the following fundamental steps in the process with the more methodological oriented researchers in the IRMCS group:
- Should we treat the data as categorical or continuous?
- What model should be used for the estimation of the quality of the questions?
- What should be the questions` characteristics that had to be taken into account?
- What was the best way to do a meta-analysis?
- How can the results be compared across languages and countries?
Categorical or continuous data
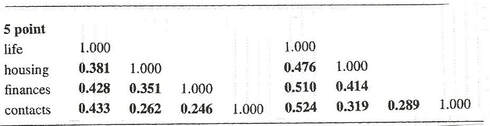
The data collected by surveys were so far mainly categorical data. We had spent a lot of effort to show that measurement on continuous scales was also possible. Some variables are by nature categorical like background variables. Therefore statistical procedures for such variables have been developed. However there are many concepts which are continuous like preferences, satisfaction etc. If such variables are measured by categorical scales one is losing information. Therefore correlation coefficients have been developed which estimate the underlying correlation assuming bivariate normal distribution (polychoric and polyserial correlation). The data of the IRMCS study of Life satisfaction shows the problem. The left correlations are Pearson correlations and the right ones are Polychoric correlations. They are computed on the same data for a category scale with 5 categories.
For our further analysis we had to make a decision which correlation coefficients we should use for the estimation of the correlation matrices of the variables in our MTMM experiments.
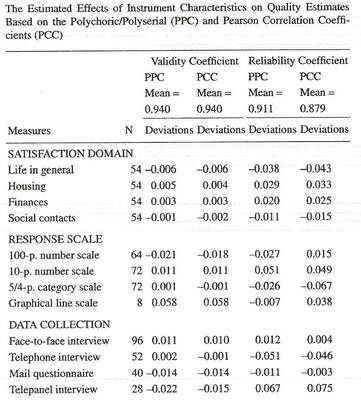
To answer this question two approaches have been used. The first was that we estimated all experiments done in the IRMCS countries using both types of correlation coefficients. Although Theresia van Wijk still was recovering from a second cancer, she wanted to work with us and did a meta-analysis across all data sets to see what difference it made in the results. It turned out that it only had an effect on the contribution of the quality of the type of scale that was used. Using polychoric correlations the quality of categorical scales was higher than if the Pearson correlations were used (Saris, Van Wijk en Scherpenzeel 1998).
To answer this question two approaches have been used. The first was that we estimated all experiments done in the IRMCS countries using both types of correlation coefficients. Although Theresia van Wijk still was recovering from a second cancer, she wanted to work with us and did a meta-analysis across all data sets to see what difference it made in the results. It turned out that it only had an effect on the contribution of the quality of the type of scale that was used. Using polychoric correlations the quality of categorical scales was higher than if the Pearson correlations were used (Saris, Van Wijk en Scherpenzeel 1998).
The other way of looking at this problem is accepting that using Pearson correlations the quality of the categorical scales are evaluated worse, but one may hypothesize that using these quality estimates to correct the observed correlations, these corrected correlations maybe good estimates of the correlations between concepts of interest. This was indeed true for the IRMCS data as the table below shows.
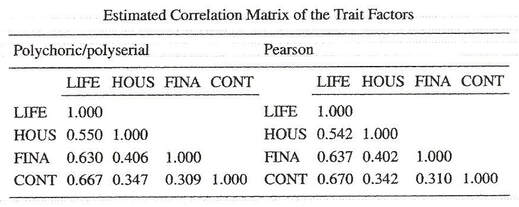

This hypothesis was tested by Germa Coenders in his dissertation using generated data. It turned out that in this way the correlations between the concepts of interest were rather well estimated thanks to this correction for lack of quality of the measures (Coenders, Satorra and Saris 1997). Germa organized a nice party for us, his SEM colleagues. Based on these results we decided to continue with the estimation of the observed correlations with the Pearson correlation coefficient.

The choice of the model
Given the choice of the Pearson correlation coefficient for the observed correlations, the classic MTMM model is in principle a specific case of a factor model. This changed when Browne suggested a “direct product model”. Germa Coenders made an overview of all possible models and showed that the direct product model could also be formulated as a specific case of a basic factor model with specific restrictions (Coenders and Saris 1997). Corten, Saris, Van der Veld, Aalberts and Kornelis (2002) computed the correlation matrices for all MTMM experiments using the Pearson correlation and the polychoric correlation. Then they also tested which of all the possible models fitted the best to the data. In both cases the classical MTMM model fitted the best to these data sets.
Given the choice of the Pearson correlation coefficient for the observed correlations, the classic MTMM model is in principle a specific case of a factor model. This changed when Browne suggested a “direct product model”. Germa Coenders made an overview of all possible models and showed that the direct product model could also be formulated as a specific case of a basic factor model with specific restrictions (Coenders and Saris 1997). Corten, Saris, Van der Veld, Aalberts and Kornelis (2002) computed the correlation matrices for all MTMM experiments using the Pearson correlation and the polychoric correlation. Then they also tested which of all the possible models fitted the best to the data. In both cases the classical MTMM model fitted the best to these data sets.

Characteristics of the questions needed for the meta-analysis
An essential for our later analyses was which characteristics should be used. In each meta-analysis other characteristics were used with respect to the formulation of the questions but also with respect to the content of the question and the topic (domain) of the questions. Because these characteristics of questions are typically linguistic characteristics, I asked Irmtraud to develop classification systems that could be applied to all three languages and preferably many more. With respect to the content of the questions she created, on the basis of the social science literature, a list of basic concepts like: evaluations, norms, feelings etc. The domain has to do with object of the feelings, norms etc. Finally she analyzed the structure of the question components such as introductions, question, statement, subordinate clauses etc. A first classification was published by us in1998.
These questions being solved, we had to code all the questions that were involved in the previous studies based on these new criteria. That was the task for the next years.
