
Willem starts his measurement research
The LISREL approach supposes that the observed variables are continuous variables. That means that all numeric values are possible. In the social science the answers to questions were normally registered on a category scale, for example “very bad, bad, neither good nor bad, good, very good”. The general idea was that people could only provide such judgements which suggest an ordering and not numerical distances. However there was a research field, psychophysics, where reseachers suggested that answers on a continuous scale were possible. I got to know this work by publications of Hamblin and Rainwather and decided immediately to shift my attention to this literature.
Psychophysical scaling
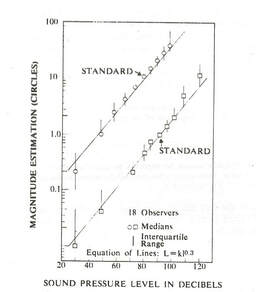
The prominent representative of this school of research was S.S. Stevens. He asked people to express their perceptions of stimuli in numbers. For example the test persons were provided with noises that differed in loudness and the task was to express the observed loudness in numbers. The first noise was the reference stimulus , called standard, which was given an arbitrary loudness value for example 100. This experiment could be done with all kinds of stimuli and the experiments resulted in a nearly perfect power function between the values of the stimuli and the responses in numbers. This relationship is linear after taking the logarithm of the stimuli and the responses. The picture at the side shows a typical result. These experiments have been repeated many times and the result is always similar only the coefficient of the relationship varies with the kind of stimuli.
Psychophysical scaling
The prominent representative of this school of research was S.S. Stevens. He asked people to express their perceptions of stimuli in numbers. For example the test persons were provided with noises that differed in loudness and the task was to express the observed loudness in numbers. The first noise was the reference stimulus , called standard, which was given an arbitrary loudness value for example 100. This experiment could be done with all kinds of stimuli and the experiments resulted in a nearly perfect power function between the values of the stimuli and the responses in numbers. This relationship is linear after taking the logarithm of the stimuli and the responses. The picture at the side shows a typical result. These experiments have been repeated many times and the result is always similar only the coefficient of the relationship varies with the kind of stimuli.
Application in social science
Given these very convincing results and very accurate results, Hamblin and Rainwather and also I were thinking, why don´t we try these experiments with social science stimuli. That was indeed done and the results were very similar. I did these experiments with two students using as respondents workers of a steel factory in the Netherlands. In one experiment we asked the respondents how much leadership´s capacity was needed if one has an N number of subordinates where N varied from 1 to 100. In another experiment we asked how good a person could do a job who had N years of experience in the job where the N varied between 6 months and 10 years. The results after logarithmic transformation were very similar to the results in psychophysics as we show below.
Given these very convincing results and very accurate results, Hamblin and Rainwather and also I were thinking, why don´t we try these experiments with social science stimuli. That was indeed done and the results were very similar. I did these experiments with two students using as respondents workers of a steel factory in the Netherlands. In one experiment we asked the respondents how much leadership´s capacity was needed if one has an N number of subordinates where N varied from 1 to 100. In another experiment we asked how good a person could do a job who had N years of experience in the job where the N varied between 6 months and 10 years. The results after logarithmic transformation were very similar to the results in psychophysics as we show below.
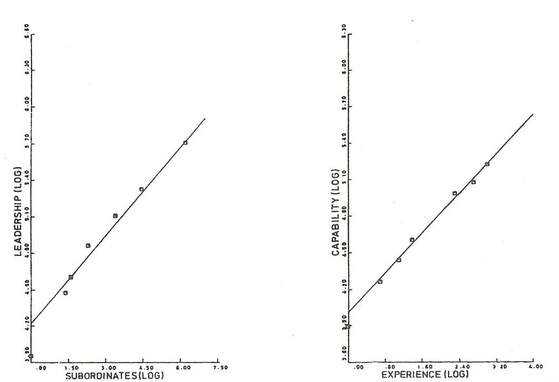
In these graphs the means over all 500 respondents are presented. In that case the relationship is nearly perfect but also for each individual the relationships were very strong. So I was very satisfied with these results. My conclusion was that magnitude estimation, as it was called, was a possibility to obtain responses on a continuous scale. Nevertheless there was a problem because I could only demonstrate the quality of the measurement if I had numeric stimuli while in social science most questions concern nonnumeric variables. Because of this problem I stopped for 2 years with the research till I detected a very interesting paper which provided the solution.
 Leo van Doorn became later director of a marketing company
The solution of the problem
I found a paper of Dawson and Brinker who suggested that my problem could be solved by asking the respondents to give their answers in two or more different “modalities”. So far we asked only answers in numbers (magnitude estimation) but one could also use length of lines as answer modality (line production) or loudness of sounds or time duration or pressure on a handgrip etc. The answers in the different modalities should be very similar after logarithmic transformation if people could use these procedures. The similarity of the responses in the two modalities is the proof of the quality of the answers that are obtained. I saw this as the solution for the measurement problems in social science research. I was very excited about these possibilities and eager to try this in new experiments.
At that moment, it was a Friday, Leo van Doorn, came to me and asked me if I was willing to supervise his master thesis research about models for arms races. I told him that I did not know anything about this topic but I could use an assistant for a research on the perception of length of lines and similar measurement problems. If he would read this weekend the first 4 chapters of a book of S.S.Stevens and would like that topic then we could start on Monday with the research. On Monday he came back and told me that he liked the topic very much and so we started the research.
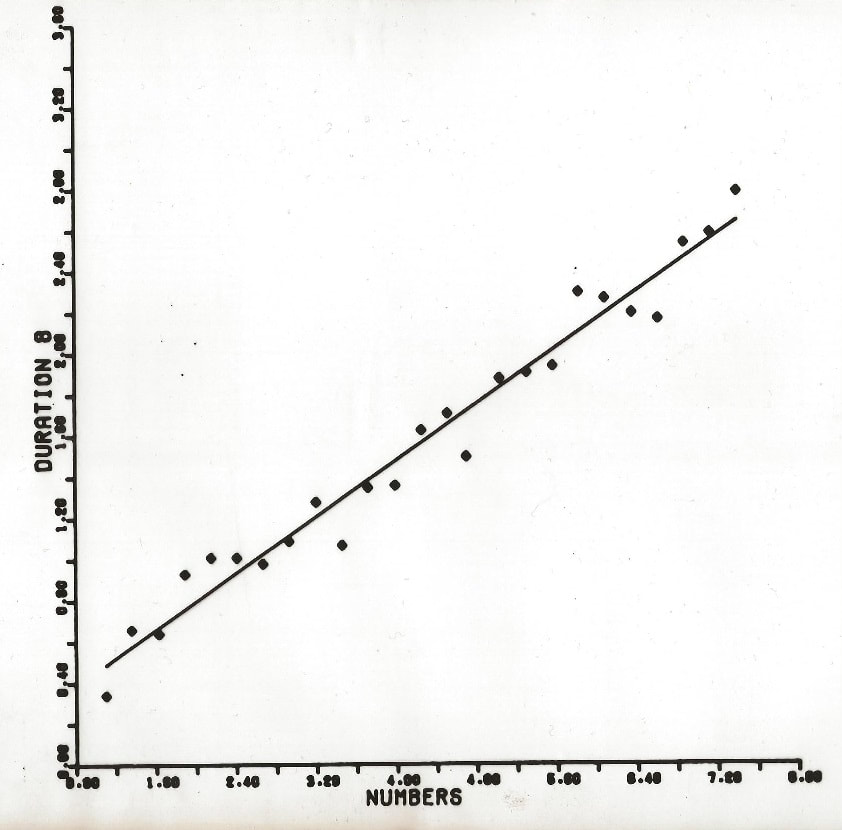
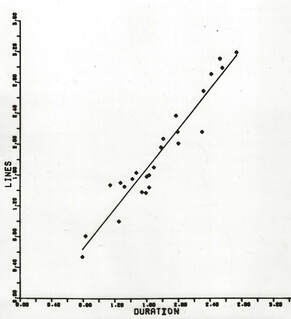
With Leo van Doorn and Peter Neijens I did my first experiment on the evaluation of the status of 15 different occupations by multimodality matching. The modalities used for the responses were magnitude estimation (numbers), line production (line length) and duration (length of time). In the graphs below we see that the relationships between the judgements in lines and numbers and duration after logarithmic transformation fitted very well to a linear curve.
|
|
This convinced us that this was the way forward to improve the quality of the measurement in the social sciences. We did not convince all social scientists with these experiments. Some are even yet not convinced about the improvement of measurement by these procedures. Therefore I suggest a simple test which should show everybody that we were right.
A test you can do yourself
Ask any person in your surrounding to evaluate different stimuli, for example, to evaluate the beauty of a number of houses. You put the pictures after each other on the table. Ask them to express their opinion in a length of a line on paper or a computer. The nicer the house the longer the line. The beauty of the first house can be presented by an arbitrary line. Then the respondent has to start with the evaluation of the other houses. I can assure you that at the third of fourth judgement the respondent will ask “can I still make corrections”. If you say yes, they will make a correction by making the line a little bit longer or shorter.
When I did this experiment on a computer with the screen with 80 positions on each line the respondents made a correction of one or two positions. So precise were their opinions. This experiment shows that people have much more information than can be captured by a category scale (5 or 7 points) but one gets this information only if one provides them with the tool to express it.
For a short scientific summary of this research and literature, look at the SRF website.
