
Promotion of Sociometrics
Given the success of the sociometric research conference I had organized in 1982, I was asked to organize in 1984 in Amsterdam the next conference of the Research Committee 33 on logic and methodology of the International Sociological Association. I had accepted this invitation not knowing in what situation I would be in that year. You can imagine that this was quite some extra work, but I could not give up this task at the moment that I became professor at the University of Amsterdam. There was quite a large participation in the conference and so a lot had to be done. Fortunately I had some assistants for the organization and my research group also helped us.
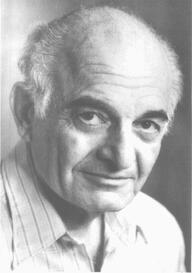 Louis Guttman when we met him
Louis Guttman the keynote speaker
I had invited again a foreign guest as keynote speaker and it was a very special one: Louis Guttman. His research was for me a typical example of what I was trying to promote the application of statistics in the social sciences. He published a lot in the Journal “Psychometrika” but his work was just as relevant for social scientists. He saw the relevance of matrix algebra for the social sciences and developed some new results. He developed a scale for social science concepts (the Guttman scale), an approach for theory developments (facet theory), multidimensional scaling to analyze the data of the facet approach.
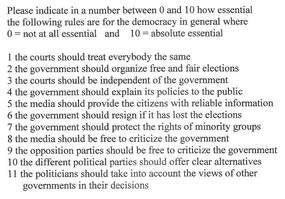
What had interested me the most was his critic on the use of factor analysis when the items differed in “difficulty”. For example, in a recent study in the European Social Survey “Support of the democracy” was measured, using the following items.
I had invited again a foreign guest as keynote speaker and it was a very special one: Louis Guttman. His research was for me a typical example of what I was trying to promote the application of statistics in the social sciences. He published a lot in the Journal “Psychometrika” but his work was just as relevant for social scientists. He saw the relevance of matrix algebra for the social sciences and developed some new results. He developed a scale for social science concepts (the Guttman scale), an approach for theory developments (facet theory), multidimensional scaling to analyze the data of the facet approach.
What had interested me the most was his critic on the use of factor analysis when the items differed in “difficulty”. For example, in a recent study in the European Social Survey “Support of the democracy” was measured, using the following items.
|
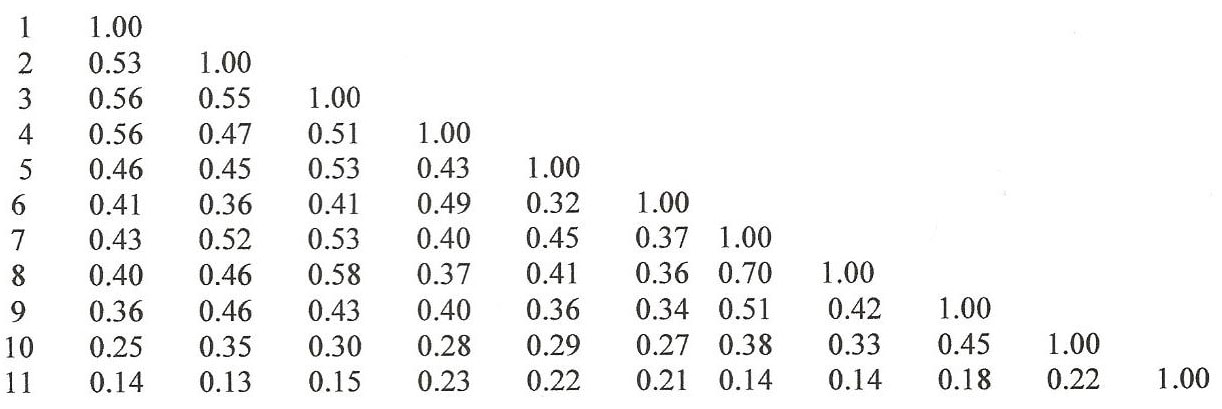
The correlations between these items in the same order
|
These items clearly differ in support. If these items are ordered from the most support to the least support the correlation matrix for these items presents a very special pattern as can be seen in the correlation matrix of the United Kingdom. We see that the correlations go down from the diagonal to the bottom of the matrix and from right to left. Guttman showed that such correlation matrices could not be represented by one factor but by two because the correlation matrix had a special structure as we see above. I don´t remember if he was speaking about this issue but this issue interested me the most as will be shown below. It was a pleasure for us to meet this important social scientist.
The conference papers
There were many papers presented by people of different, especially European, countries on statistical approaches to data analysis and measurement issues. This was exactly the kind of research I wanted to promote. In order to share these results with the scientific community of sociale science research and to promote sociometric research Irmtraud and I prepared two books on Sociometric Research, one on Data Collection and Scaling and one on Data analysis. These books were published by Macmillan Press the year after the conference.
There were many papers presented by people of different, especially European, countries on statistical approaches to data analysis and measurement issues. This was exactly the kind of research I wanted to promote. In order to share these results with the scientific community of sociale science research and to promote sociometric research Irmtraud and I prepared two books on Sociometric Research, one on Data Collection and Scaling and one on Data analysis. These books were published by Macmillan Press the year after the conference.


It would lead too far to discuss the content of the books. Let me mention some special issues. Stochastic Unfolding was introduced together with the program Mudfold by Van Schuur. Splichal and Ferligoj introduced a formal text analysis procedure for the study on ideologies. Van Doorn and Van Praag showed that correction for measurement error in economic variables make the explanation of income evaluations nearly perfect. The conditions for causal conclusions based on randomized experiments were discussed by Steyer. Hagenaars and Luijkx showed the attractiveness of Logleair models also in case of latent variables. This is only a limited list of the interesting paper we had selected for the books.
Variation in Response functions
Variation in Response functions
Looking at this publication I saw that I published in one of these books also the first results on the issue that I have called “Variation in response functions”. Visiting Milton Lodge in Stony Brook I got the idea that it may be that people express their opinions in different ways. There I could not proof it because different responses can be due to different opinions or different ways of expressing these opinions. I needed data were there was no doubt that people had the same opinion.
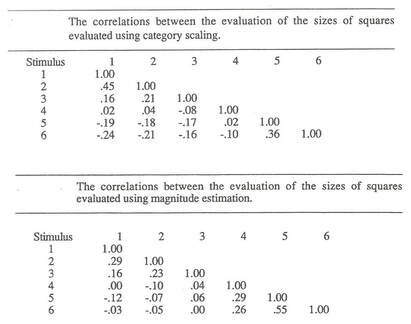
I found these data in an earlier research where 500 people of a steel factory in the Netherland participated in an experiment to test psychophysical scales. Before the real questions, the people got as a training task the evaluation the sizes of six squares. They were asked to express their opinions in categories and in numbers. In the paper I showed by specifying a response model where people would use different response functions that one should expect a special pattern in the correlation matrix. This pattern was indeed observed in the matrices for categorical judgments and numerical judgments of sizes of squares. In both matrices we saw the same pattern as expected by Guttman however there is an important difference with the correlation matrices expected by Guttmann´s theory: the negative correlations. They cannot occur in Guttmann´s model.
Conclusion
I concluded that this was a different phenomenon which we planned to study carefully given its importance for social science. If the explanation was indeed variation in response functions across people, the responses to questionnaires cannot be compared. Also the correlations between variables cannot be trusted if they contain so large artefactual correlation due to variation in response functions between respondents.
